Automatic Evaluation
Introduction
There are various ways you can use Geometry & Graphs.
- As a dynamic resource to illustrate mathematical concepts
- Combined with other question types
- As a standalone question type
You can see an example of each use case below.
Live example: Three use cases of Geometry & Graphs.
This section concerns the third use case: Geometry & Graphs as a question type.
Evaluation criteria
You can specify evaluation criteria to score a student's work. Algebrakit will evaluate the criteria one by one until it finds a criterium that results in student feedback. The student successfully finishes the exercise when all criteria pass.

There is a panel for writing evaluation criteria. Click on the bar to add your first evaluation criterium. Click the bar again to collapse it again. Hover over the criterium to access the buttons to add or remove criteria.
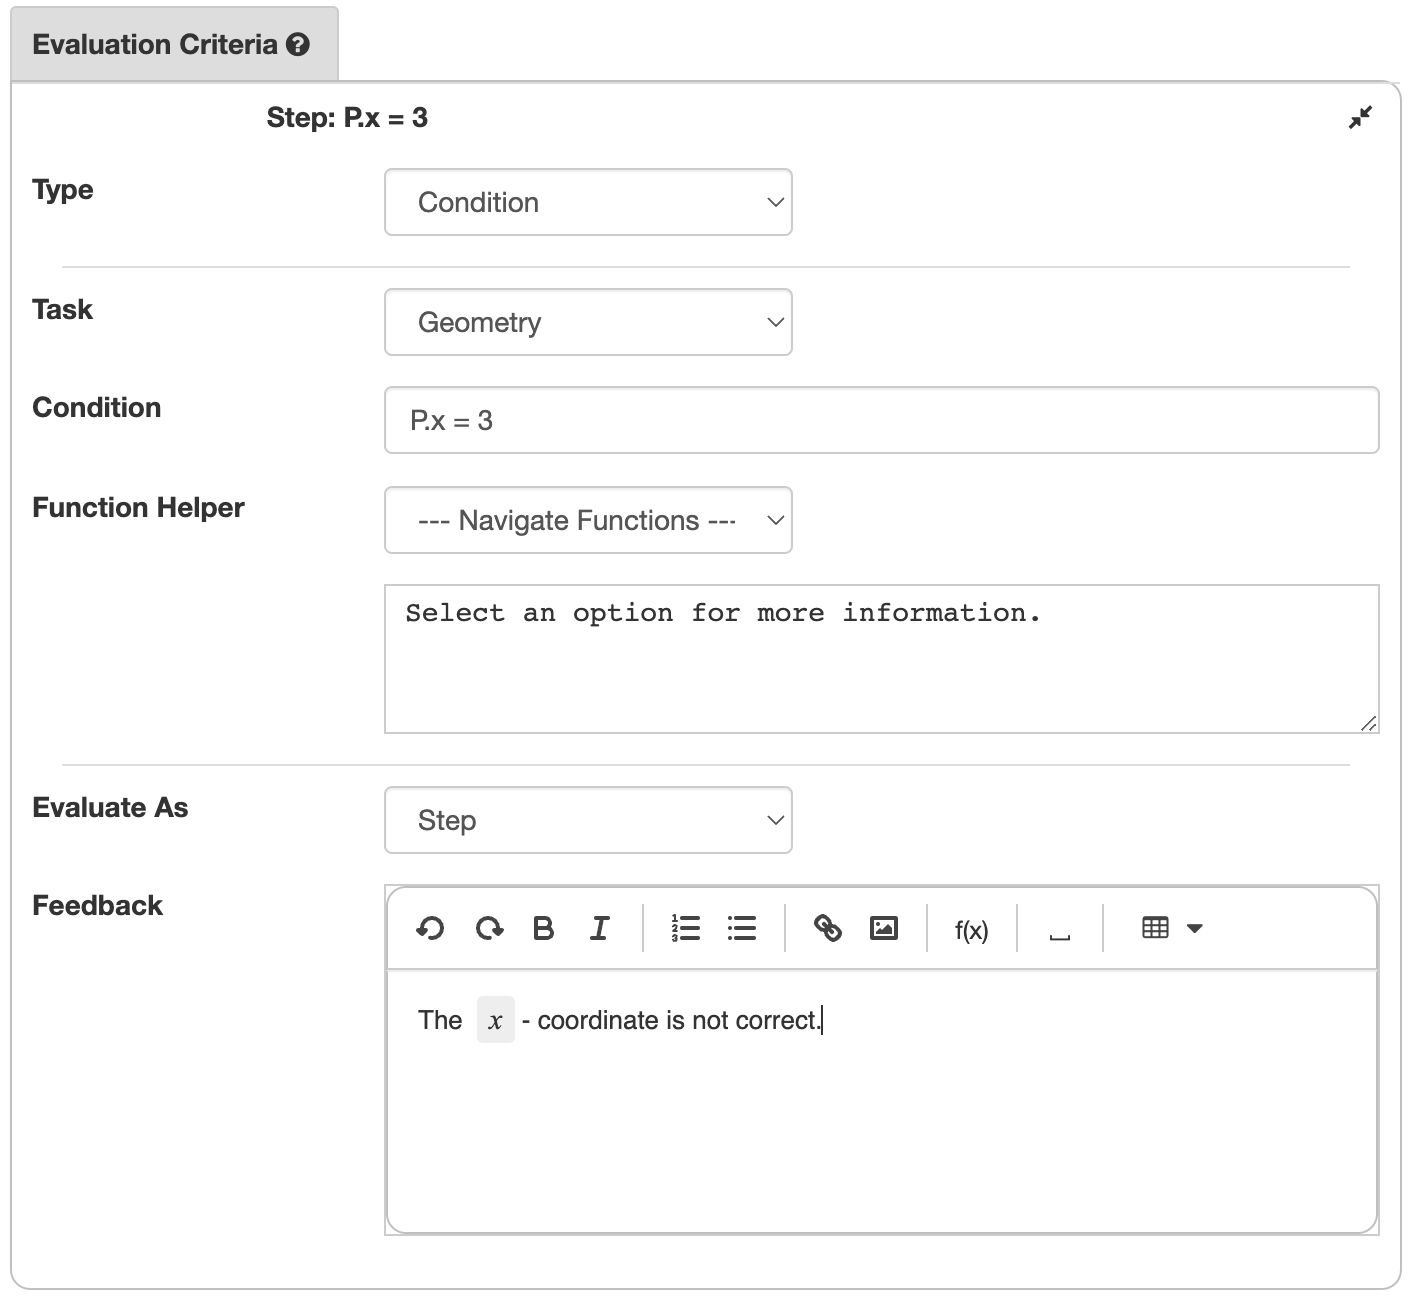
An evaluation criterium consists of the following elements:
- Criterium type equals Condition or Existence. Existence criteria are for elements that students must create and therefore do not exist yet. We will discuss these below.
- Task equals Geometry or Graphing. The default value is Geometry. Use Graphing in criteria for graphs.
- The Condition is the rule this criterium will evaluate.
- Evaluate as equals Step or Error. If the value is Step, the student input should satisfy the condition. If the value is Error, the student input should not satisfy the condition. Error criteria allow you to give feedback in specific situations.
- Feedback is the student message in case the condition of an Error criterium is valid, or the condition of a Step criterium is not valid.
We will discuss the following concepts of evaluation criteria below.
- How to write conditions
- Using conditions on reference elements
- How to write criteria for elements students will create (Existence criteria).
- How to evaluate graphs.
Writing conditions
Conditions express a relation on element properties. Some examples of element properties are
- the or coordinates of points
- the slopes of lines
- element colors
- the angle size of Angle elements.
You indicate an element property by writing the element ID and the property name with a dot in between. For the examples above, this looks like A.x, l.slope, P.color, and alpha.angle.
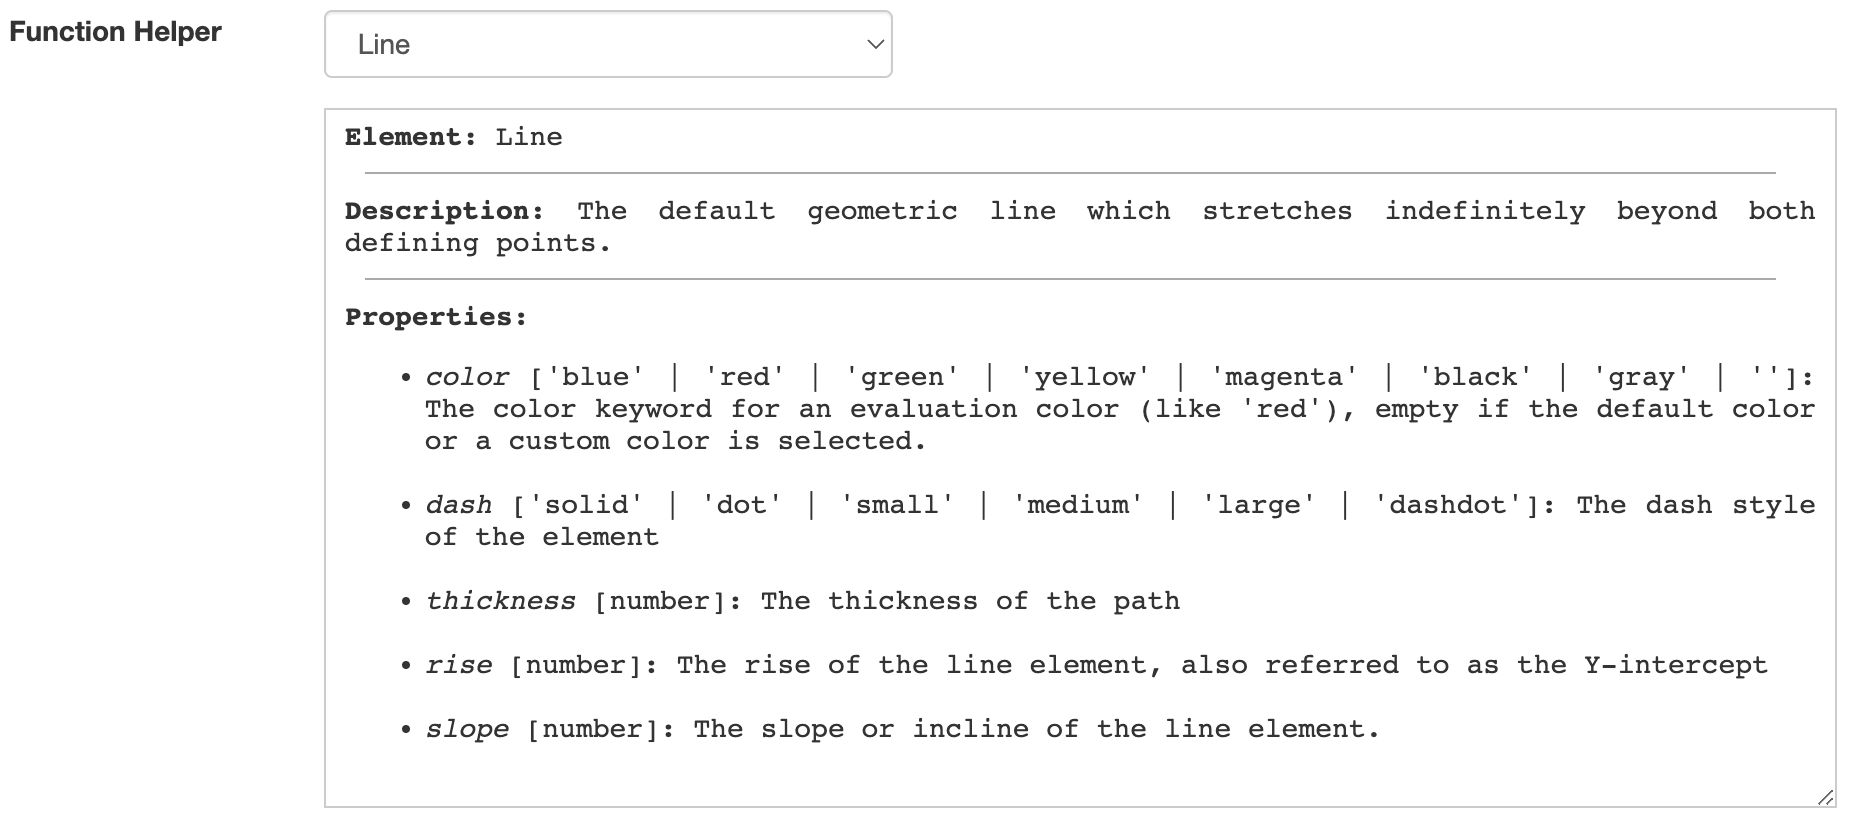
Use the Function Helper to see the properties available for each element type.
You can write relations as follows:
- Using standard equality and comparison symbols
A.x = 3alpha.angle <= 30
- Combining multiple relations using the boolean operators AND, OR, and NOT
A.x = 3 AND A.y = 4alpha.angle <= 30 OR beta.angle <= 30
- Using special relation functions. Write the arguments in square brackets.
Congruent[polyA, polyB]is true ifpolyAandpolyBare the IDs of congruent Polygon elements.InRange[alpha.angle, 28, 32]is equivalent toalpha.angle>=28 AND alpha.angle<=32.
You can also check if two elements are equal. For example, P=Q is true if elements P and Q are of the same type and have equal properties.
You can find more functions in the Function Helper. Some examples are:
Difference[a, b]: The absolute difference .PointDistance[P, Q]: The distance between pointsPandQ.PointLineDistance[P, l]: The shortest distance between pointPand linel.
Using reference elements
We showed that conditions apply to element properties. You can also refer to elements that are invisible to students. This is convenient in several situations:
- You want to check if an element is equal to an element in the solution
- You want to check for a specific incorrect answer
- A utility element can sometimes simplify writing the condition.
Consider the following example for the exercise "Move point to coordinates ".
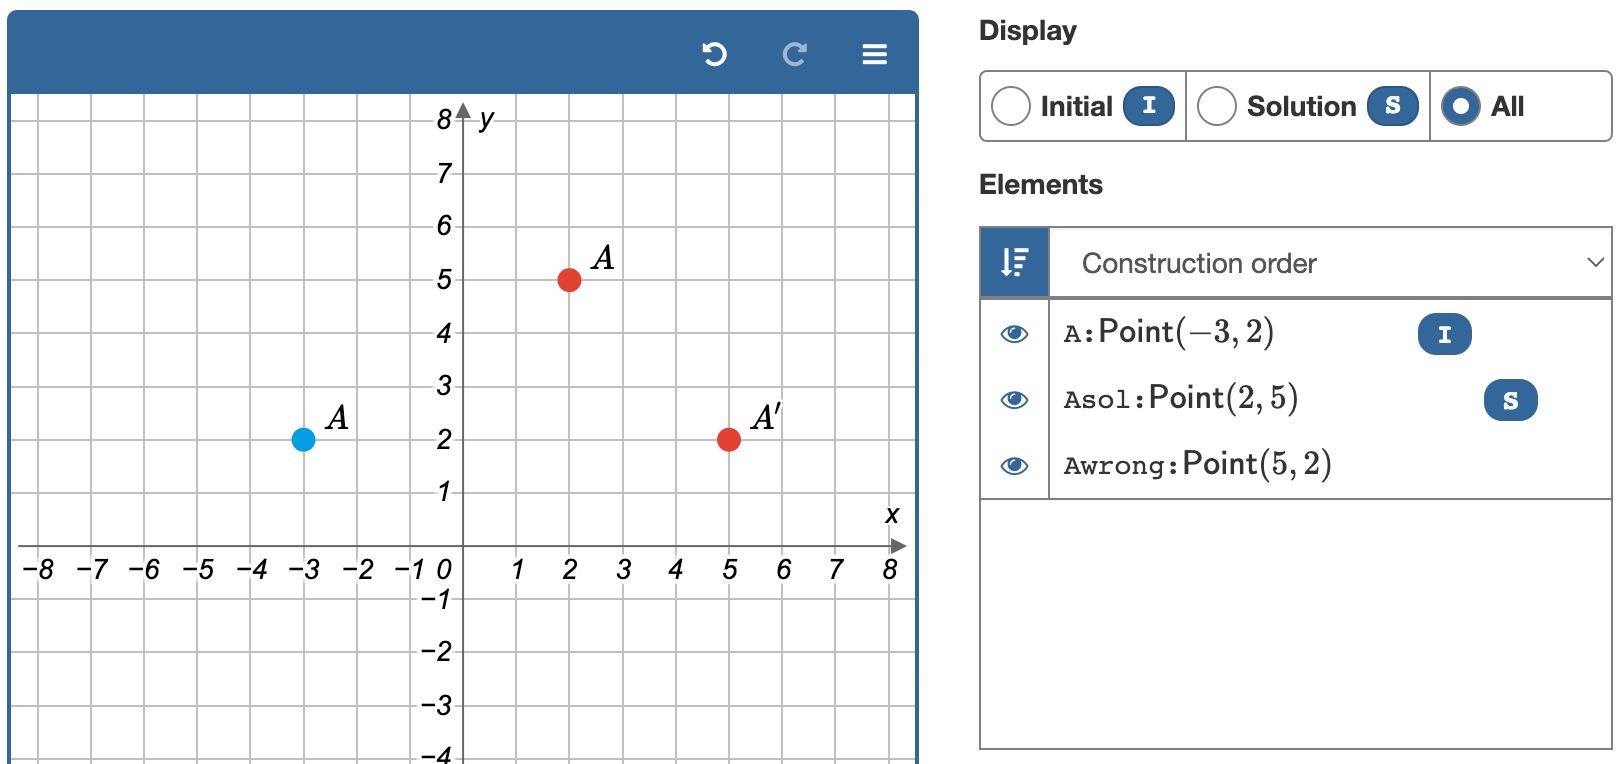
The three elements in the canvas all have the label , but they have different IDs.
- Point
Ais visible when the exercise starts. This is denoted by the I symbol (of Initial) in the element panel. - Point
Asolrepresents the correct solution. The S symbol indicates this element is part of the solution. - Point
Awrongrepresents the incorrect result if the student swaps the and coordinates. This element has no I or S marker in the element panel and is therefore never visible.
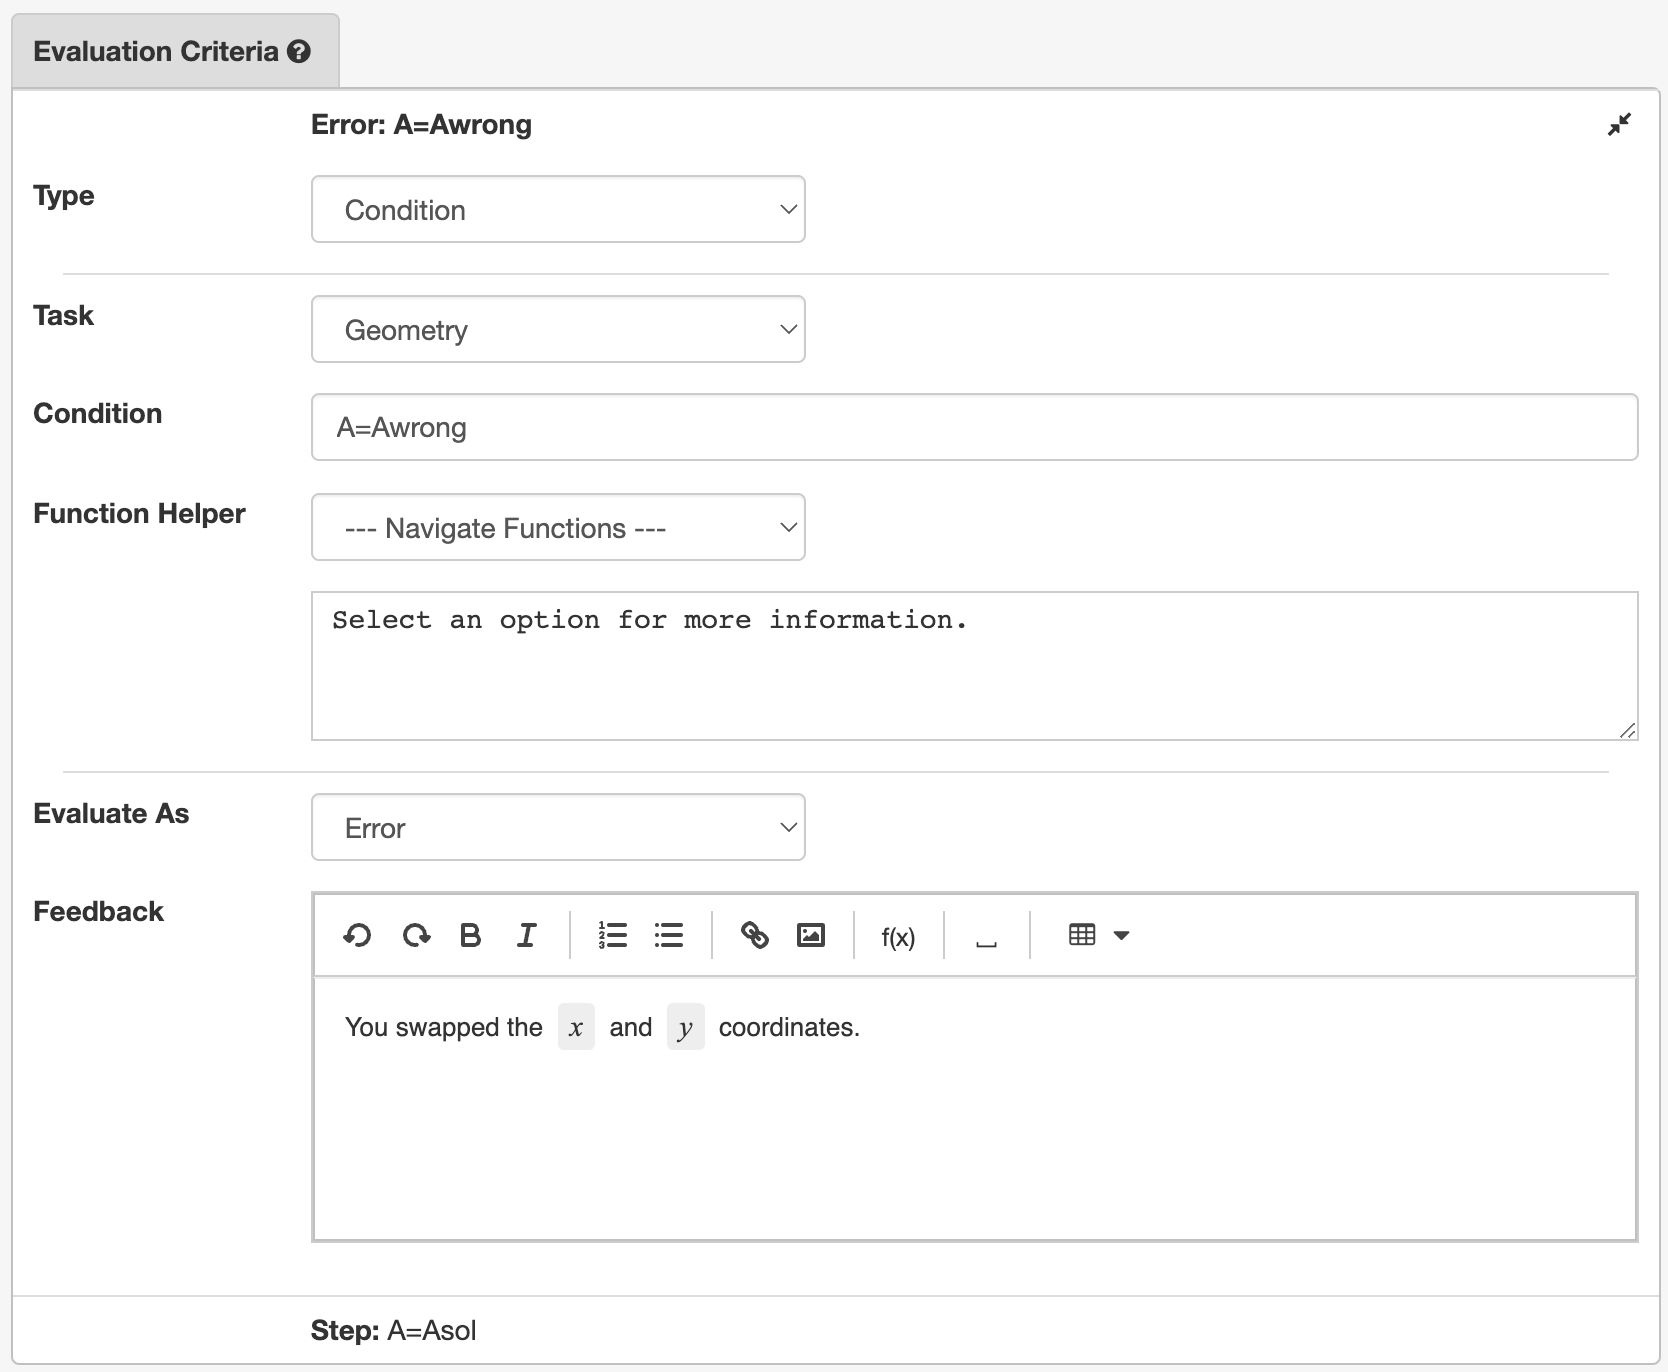
Live example. Use the buttons to inspect the solution and to see how this exercise was created.
Existence criteria
Until now, we have considered exercises where students work with elements that were already present. However, in some exercises, students create new elements using the tools you provided. How do you create conditions on elements that do not exist yet?
A basic example
The exercise is to draw point . Students have an empty coordinate system and a Point tool to create the desired point. We will create an evaluation criterium that states:
There must be a point, let's call it , such that P.x=2 and P.y=5.
You can dissect the criterium in the following parts:
- A dummy element ID (
P) which represents the element we will evaluate. - An element type (Point) to indicate that this criterium applies to Point elements only.
- The condition for element
P.
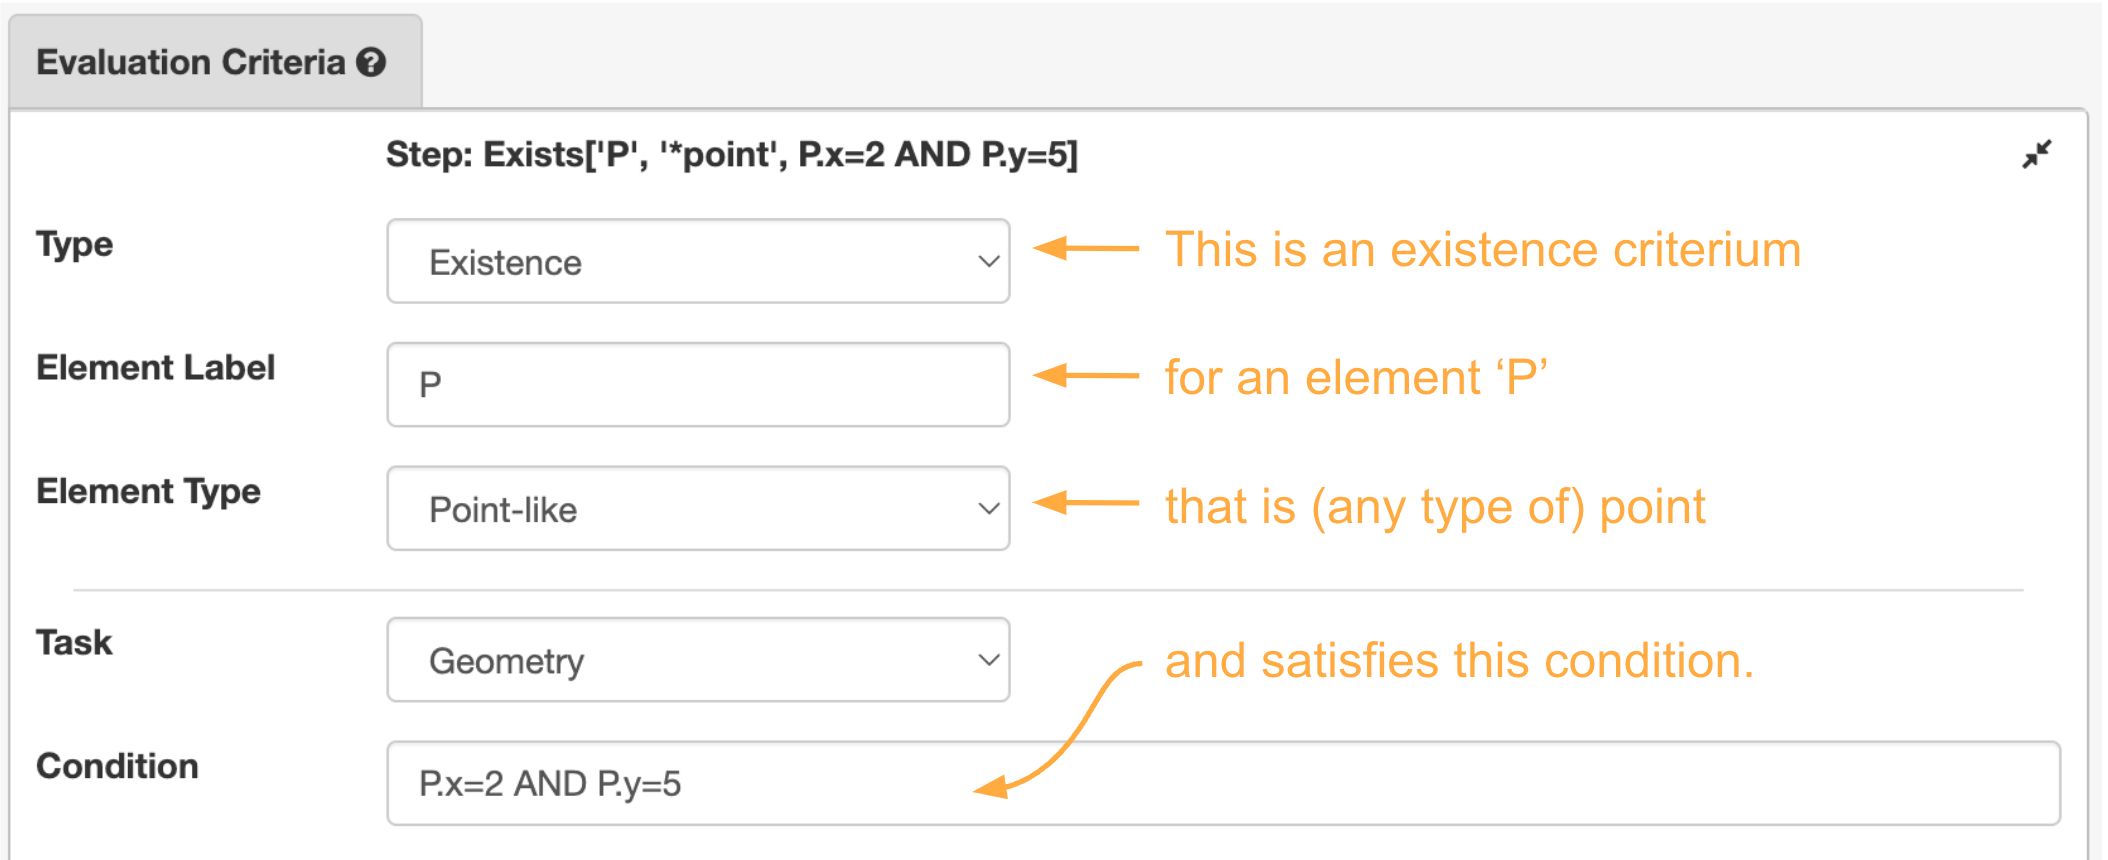
An example using a reference element
The exercise is to create the circumscribed circle of a triangle. This is the circle through the three points of the triangle.
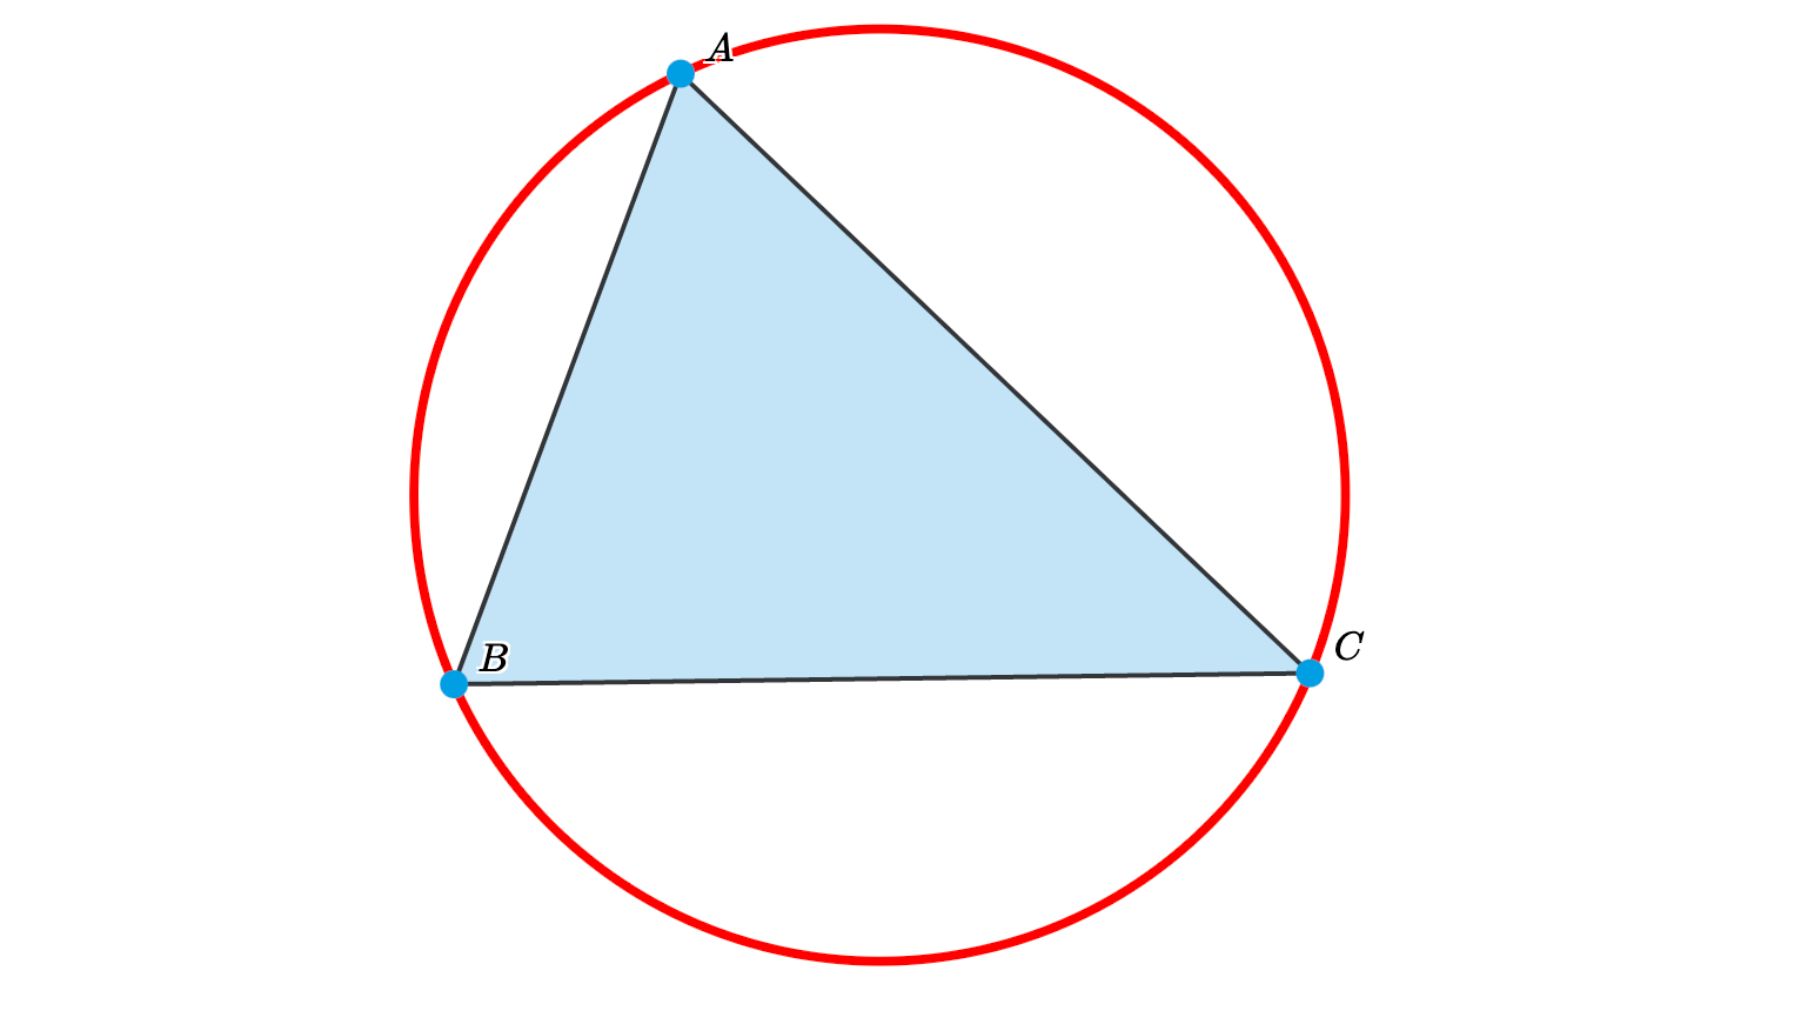
Students see a triangle and have access to the tools to construct the circle.
It is difficult to write a condition for this circle. It is much easier to create the solution yourself and just refer to the solution element.
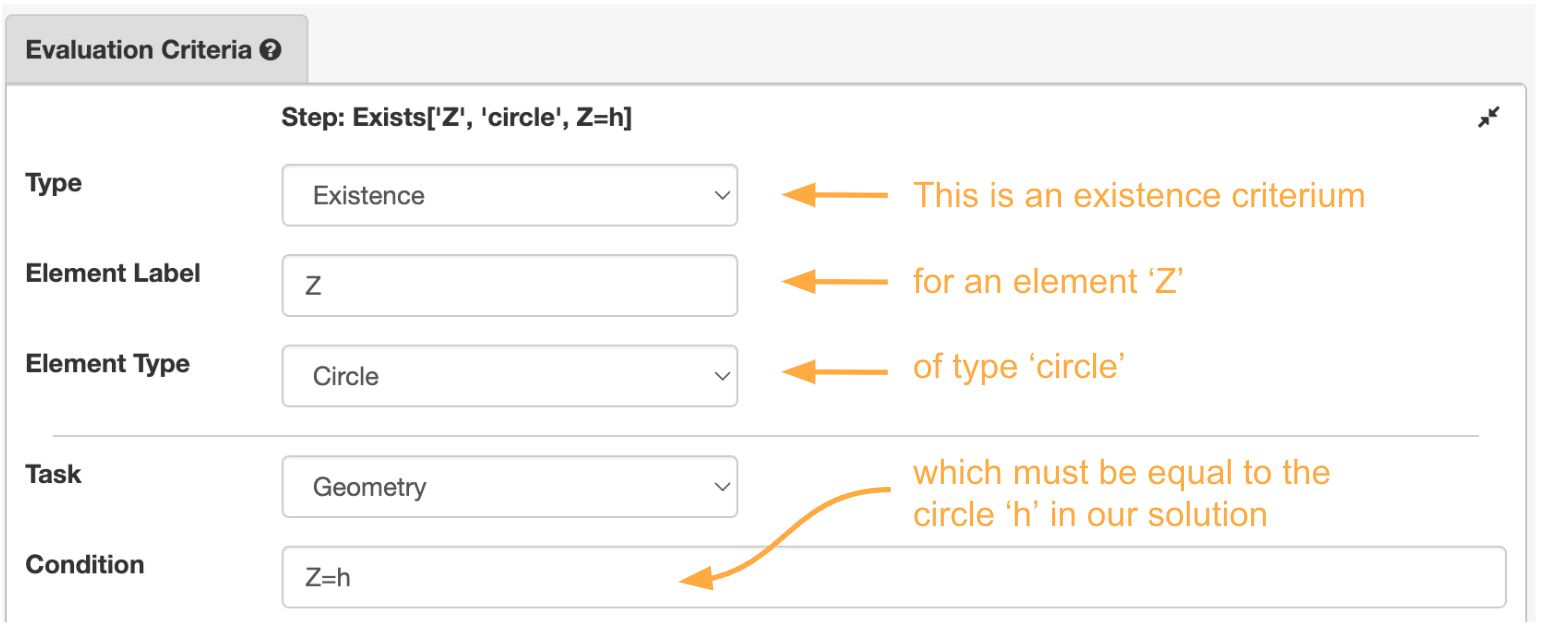
Here are two live examples of these exercises. Use the Edit button to see how we created it.
Evaluating graphs
The Graph tool allows students to draw smooth curves. You can use this tool to let students 'sketch' graphs.
To evaluate a graph, you compare it with a reference graph you created yourself. It is often unrealistic to expect students will draw the exact same graph as you did. Instead, you want to check if it approximates your solution graph well enough.
You can choose one or more of the following condition types:
- The average deviation to the solution graph
- The maximum deviation to the solution graph
- The domain of the graph
- Whether the graph passes one or more key points.
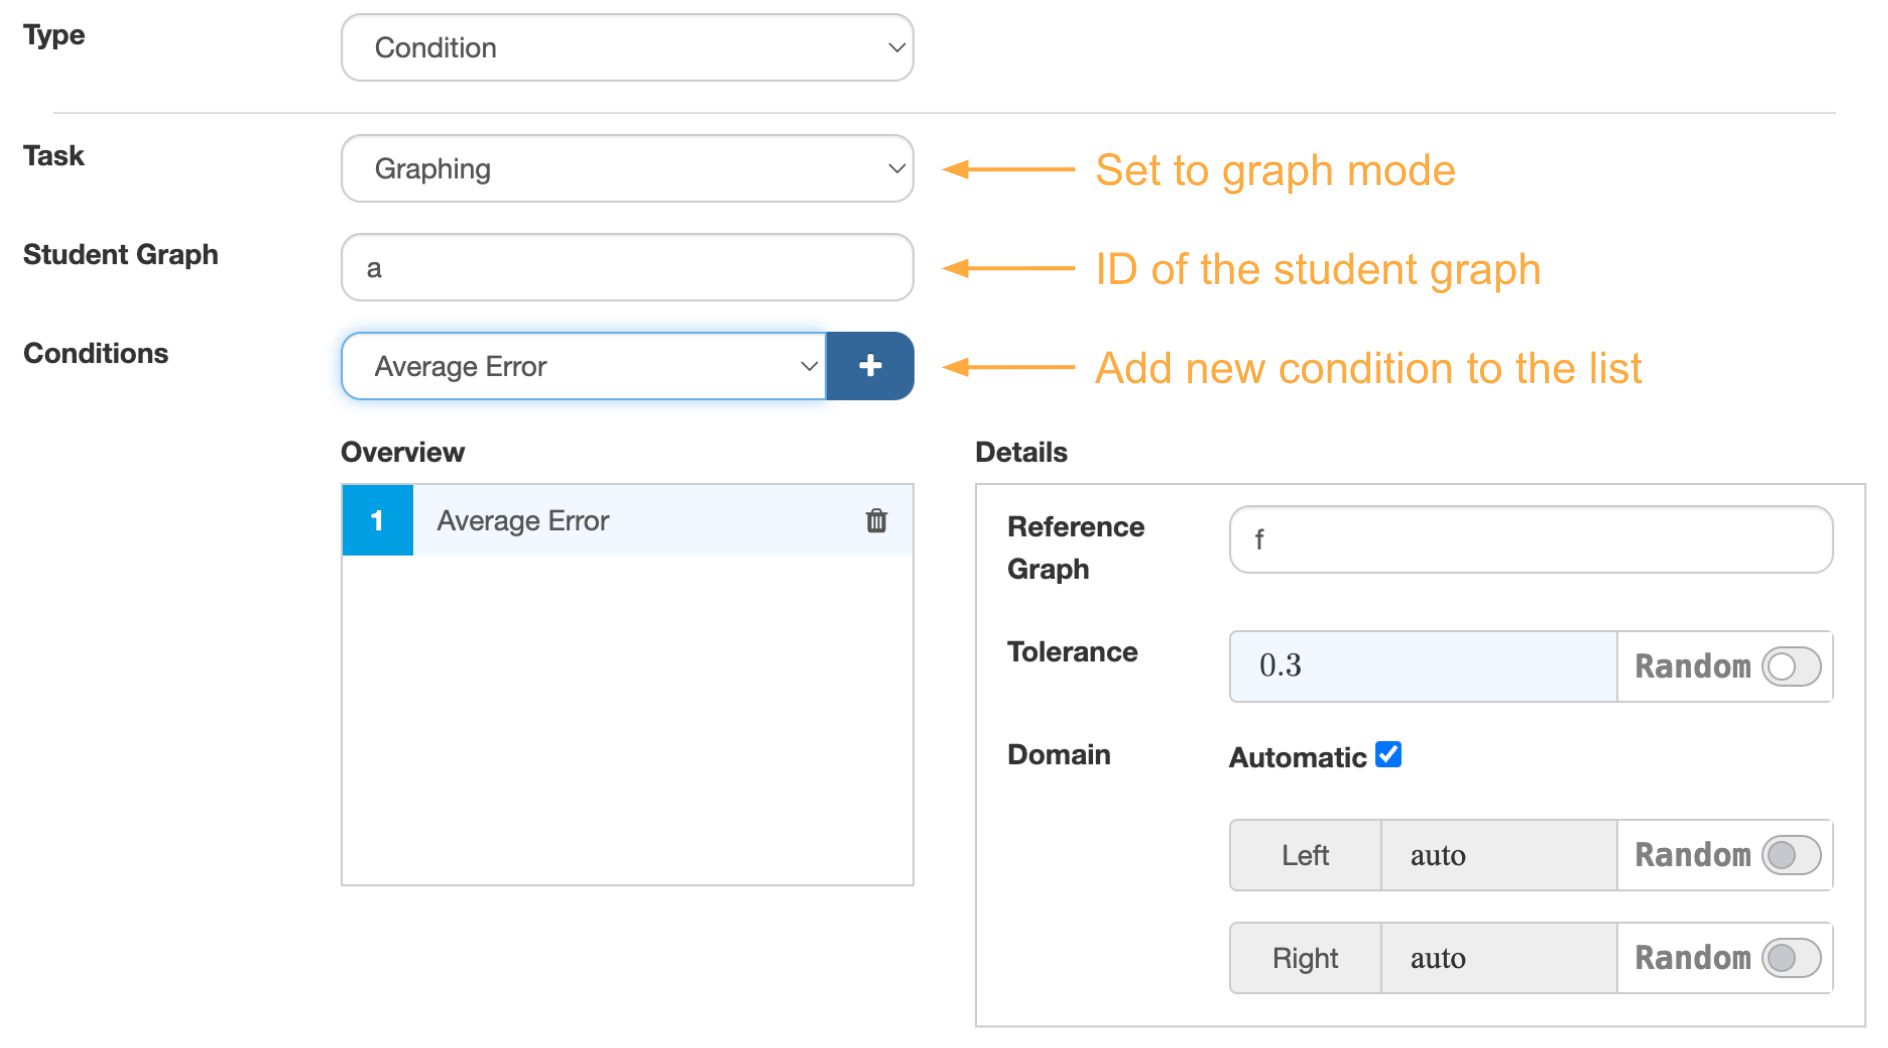
To set up an evaluation criterion for graphing, perform the following steps:
- Click the Evaluation Criteria bar to open it
- Add a new evaluation criterion
- In Task, select Graphing. This reveals the options for settings up the criterion for evaluating a graph.
- Input the ID of the student graph you want to evaluate. You need to add a Graph element to the construction first and read the ID from the Element Panel.
- In Conditions, select a condition type from the dropdown and add it to the list. You can add multiple conditions to the list.
- Click on a condition in the list and set its options.
- In Feedback, you set the message to show students if the graph does not pass the conditions.
