Axes and coordinates
Introduction
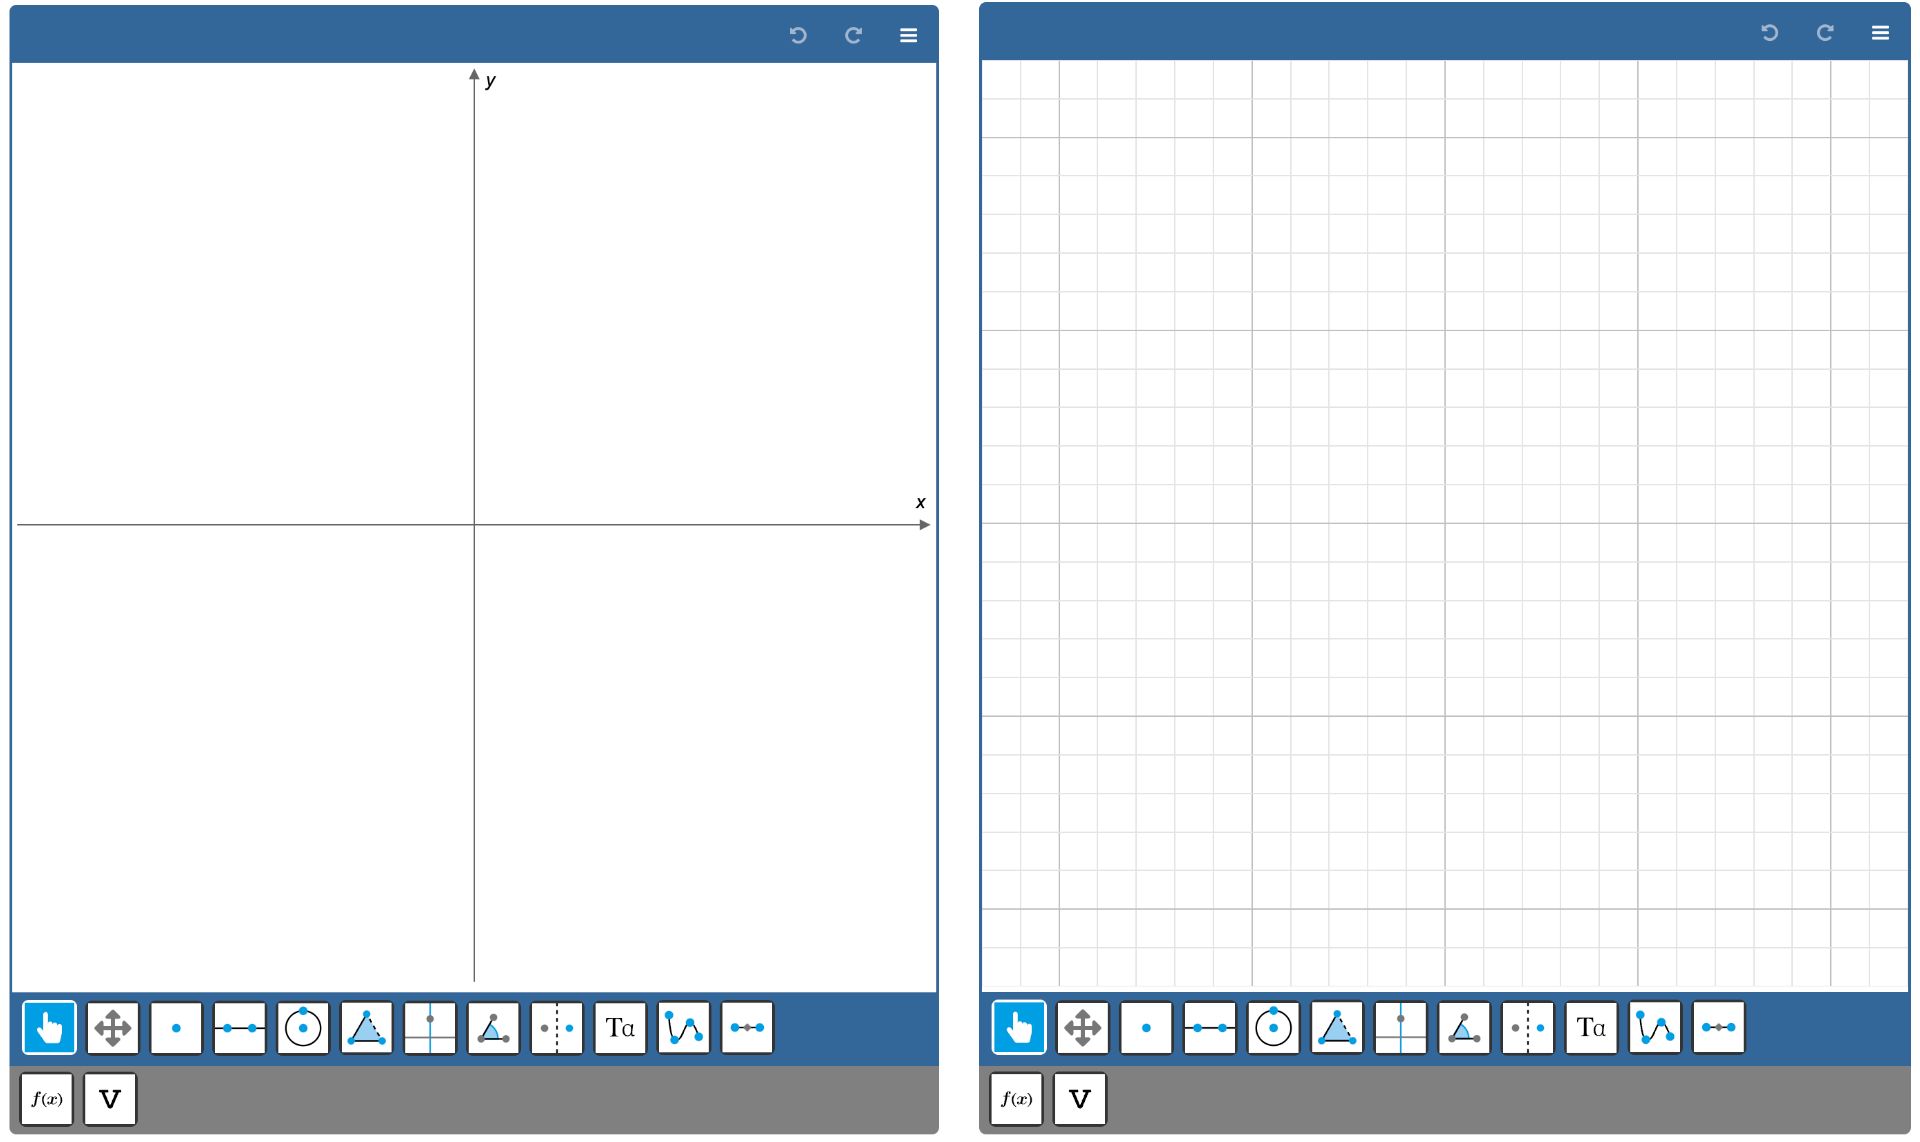
Geometry & Graphs applies not only to classical geometry but also to two-dimensional coordinates and graphs. You can configure several aspects of the coordinate system:
- ranges and stepsizes
- hide or show the axes
- hide or show grid cells
- axes labels

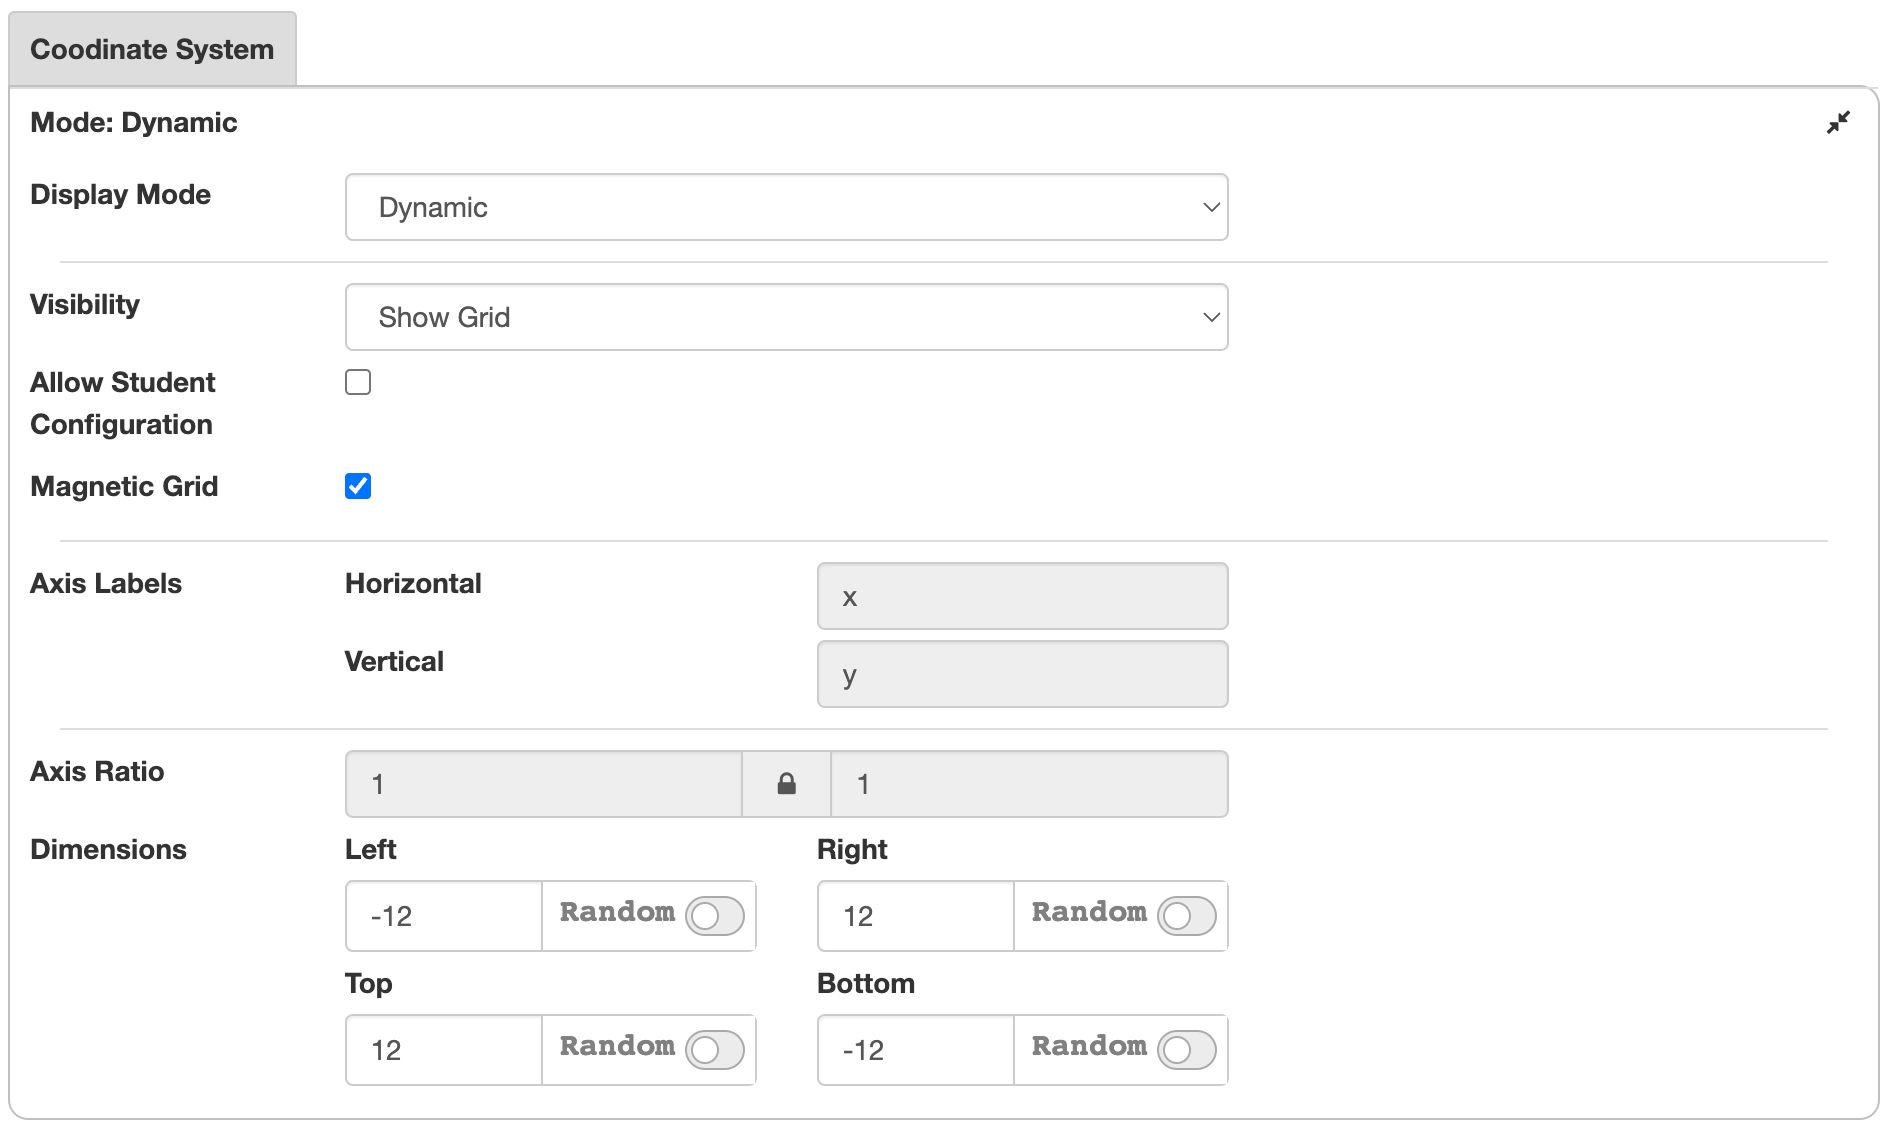
The coordinate system configuration panel
Click the Coordinate System bar below the construction canvas to reveal the configuration properties.

We will discuss the options that are not self-explanatory.
- The Display Mode controls whether the grid will auto-adjust to the ranges. We will discuss this topic in more detail below.
- Allow student configuration. If enabled, students can change the visibility of the grid and axes through the menu in the top bar. Enable the Zoom and Drag Canvas tools in the toolbar to allow students to change ranges and step size.
- If Magnetic grid is enabled, points will snap to the intersections of the main grid lines. This facilitates positioning points on exact coordinates, such as instead of .
- The Dimensions specify the ranges of the coordinate system. Note that the aspect ratio is default locked, so changing the dimensions of one axis will also impact the other axis. You can unlock the ratio by clicking the Axis Ratio lock symbol.
You can use random exercise parameters to set minimum and maximum values. We will discuss this in the randomization section.
Display Mode
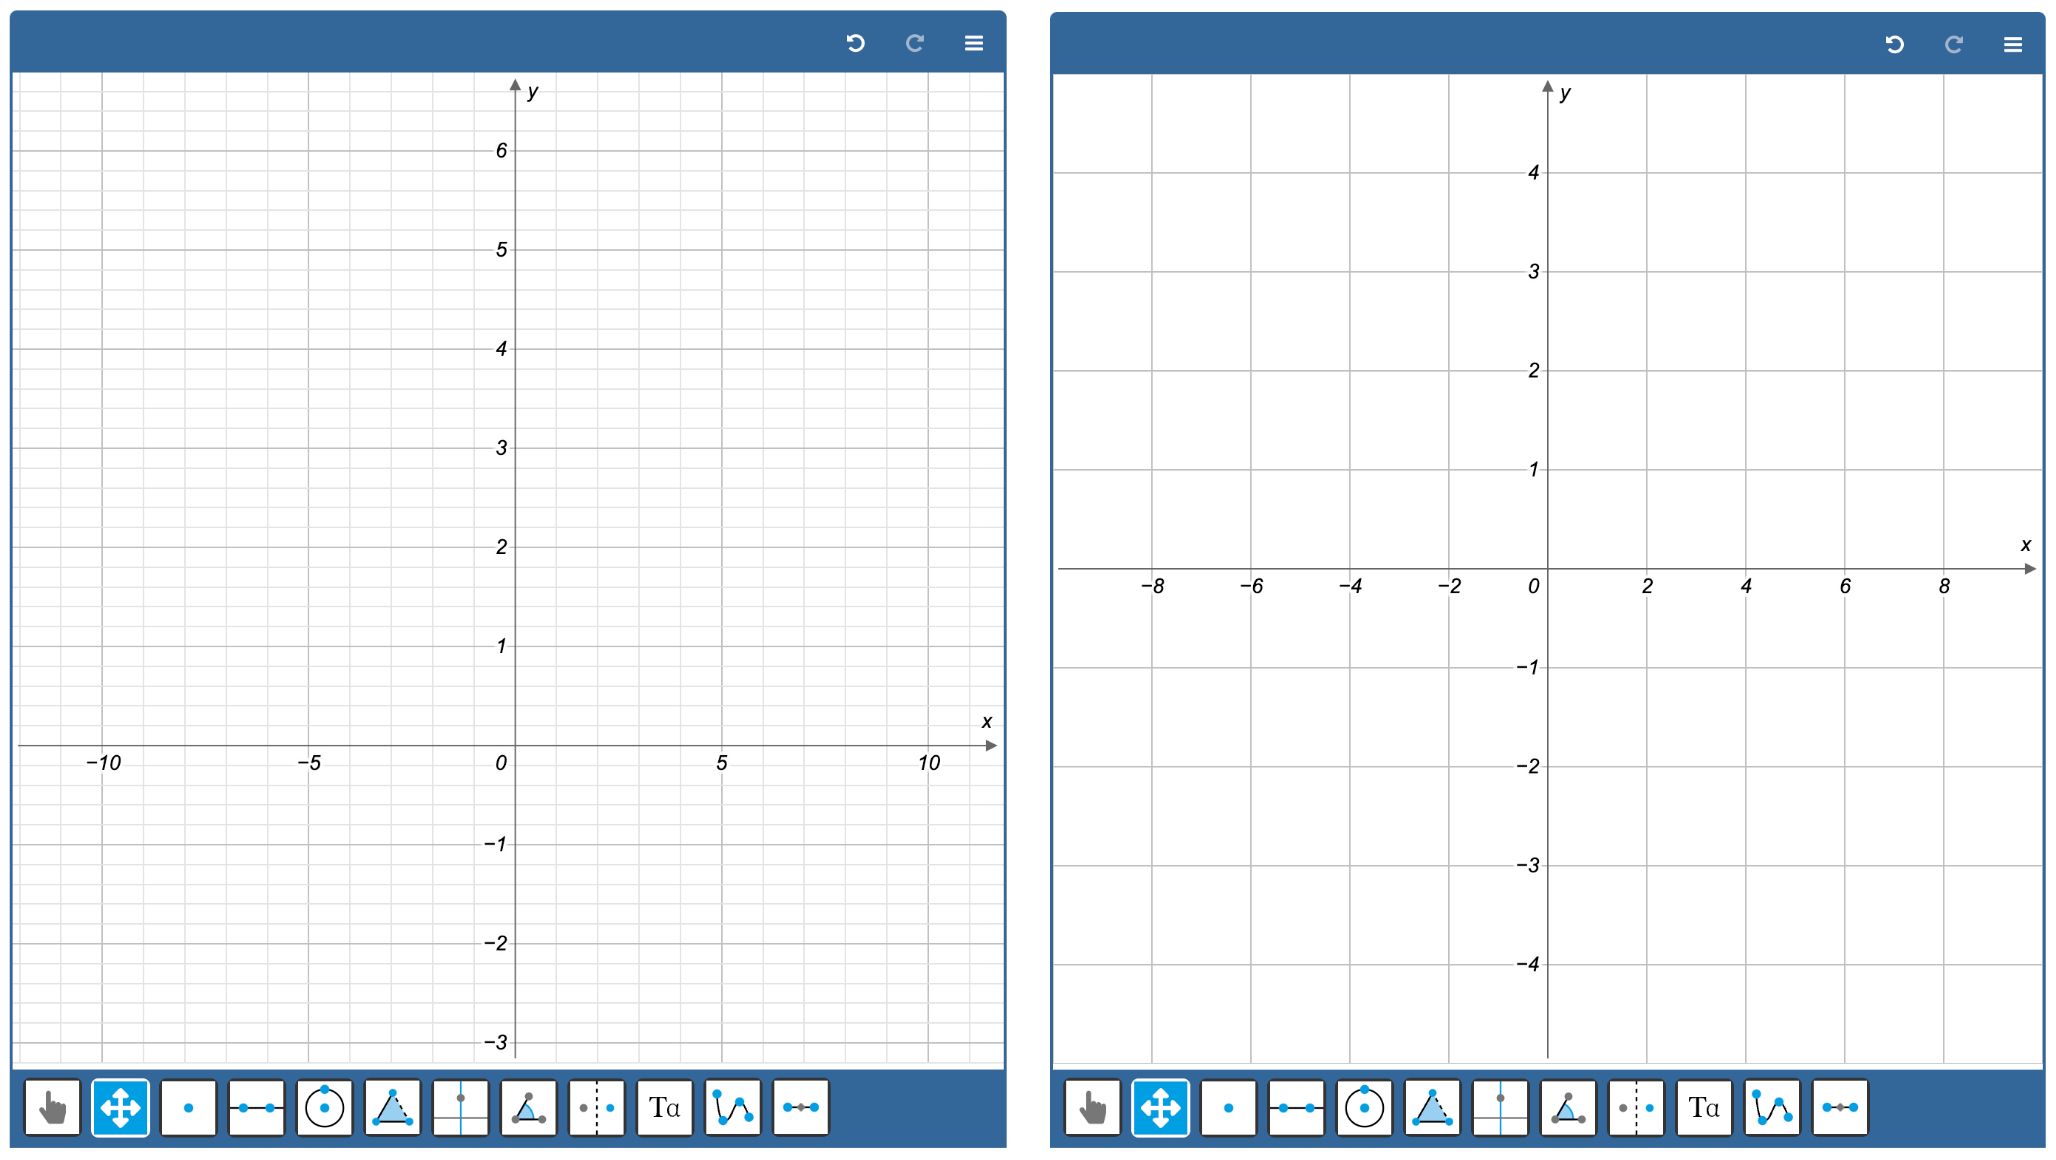
There are two approaches to defining the coordinate grid in math education.
- In a digital system, the grid is generated automatically. Depending on the display size and the axes' range, the system chooses suitable grid lines. If you zoom in, the system will add new grid lines. The cells are not always square.
- When using graph paper, the grid cells are preprinted on paper. Students have to decide what is a suitable step size for each axis. If you zoom in, the system does not add new grid lines. The grid cells always have the same shape (a square if you choose the same number of subdivisions in each direction).

